
Features
OpenSecDash follows a simple flow:
Datasources → Enrichment → Event Store → Correlation → Dashboard / Explorer / Actions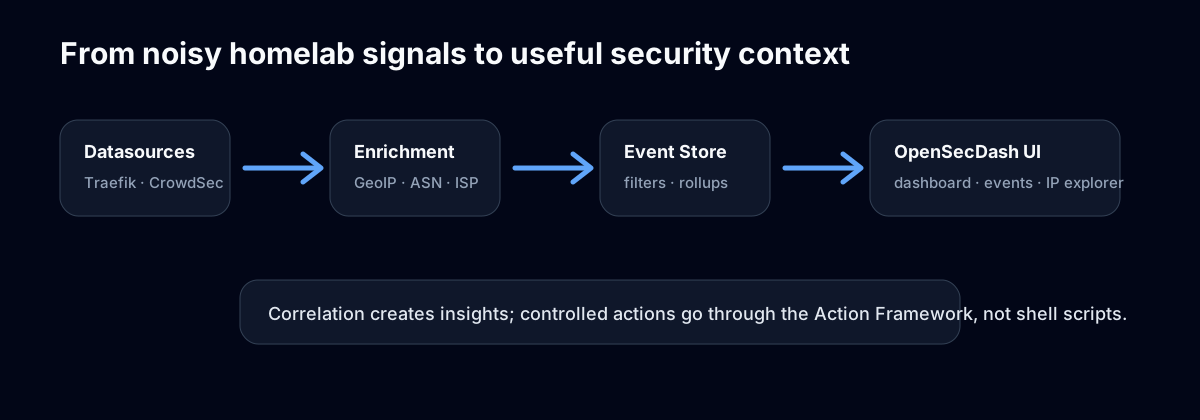
The current feature set covers the complete workflow planned for the first stable v1 release. Later extensions such as additional notification channels, an asynchronous action queue, advanced Level 2 correlation chains, and full offline operation remain deliberately outside this scope.
Live-first dashboard
The dashboard gives you a quick overview of current homelab security activity:
- CrowdSec bans
- GeoBlock events
- external and internal access events
- assets and available updates
- top countries
- busiest attack/access hours
- recent security context
- small comparison badges based on yesterday's rollups when available
Dashboard content comes from a widget container. Enabled plugins can contribute validated counter, table, feed, and trend widgets; the core renders those descriptors and plugins do not provide dashboard HTML. For example, CrowdSec contributes its active-ban counter and GeoBlock contributes today's geoblock counter, while cross-plugin lists such as top countries remain core-owned.
To adapt the dashboard for a homelab, open Customize dashboard. Clear a widget's checkbox to hide it, use the up/down controls to change its order, and choose Apply layout. Reset layout removes the saved customization and restores the default ordering and visibility. A widget from a disabled plugin disappears after reload; if the plugin is enabled again later, its widget is added back visibly. Widget links open the corresponding filtered Events or Assets view. With internal authentication enabled, each user has an independent dashboard layout; without it, the layout remains global to the instance.
The Events page supports Live and Snapshot modes. Live mode keeps the UI fresh. Snapshot mode freezes the current view so you can filter and inspect without the table moving under your mouse.
Historical rollups live in the Rollup Explorer, while the Dashboard stays focused on today's activity.
See Dashboard for widget customization, per-user layouts, live refresh, and historical drill-downs.
Events and access logs
OpenSecDash stores events with structured fields and optional raw data:
- event type, plugin, source
- IP address, country, city, ASN, ISP
- hostname, path, method, status code
- severity
- event timestamp
- plugin-specific JSON payload
Events use a stable taxonomy such as:
access.allowed
access.denied
access.error
security.ban
security.geoblock
security.torblock
action.executed
action.failed
Search and filters
The Events and Access views support practical filters for homelab investigations:
- event type, including wildcards such as
access.* - IP address
- country code, country exclusions, and comma-separated country lists
- exact status code or an inclusive status-code range
- ASN, hostname, and asset
- path
- plugin/source
- local-IP include/exclude behavior
- bounded text search with boolean expressions such as
wp-login && (404 || 403) - optional JSON/raw-data search for payload-level investigations
Operator filters are structured URL parameters rather than a free-text query language. For example, /events?country_in=RU,CN is the structured equivalent of country IN (RU,CN) and investigates traffic from a country list; /events?country_not=DE excludes German traffic, and /access?status_min=400&status_max=499 shows client-error responses. The Events filter form also exposes status ranges, ASN, and hostname; URL filters make the same investigation links shareable.
Events and Access start with the last 24 hours for a new user or installation. Choose Last hour, 24 hours, 7 days, or 30 days in the time-range picker; choose All time explicitly for the complete retained history. The selected range is retained when moving between Events and Access and is stored with saved views. For a custom range, use a shareable URL such as /events?range=custom&from=2026-07-12T00:00:00Z&to=2026-07-13T00:00:00Z.
The header has one global search box. An IP address or CIDR opens the IP Explorer, a matching asset name or hostname opens Asset Explorer, and other searches open matching Events. For example, searching /wp-login.php opens Events with that search term.
Saved views
Both Events and Access have a Saved views area above their filters. Give the current filter set a name to save it as a reusable link; a view called 404 errors can preserve status_min=400 and status_max=499 for a reverse-proxy investigation. With internal authentication enabled, saved views belong to the signed-in user, and saving the same name again in the same area replaces that user's view. Without internal authentication, saved views remain global to the instance. Plugins can also show read-only provided views alongside your own views.
Long values such as paths, URLs, user agents, and ISP names are truncated in tables and can be opened in an overlay.
IP Explorer
The IP Explorer is the “what happened with this address?” view. It combines:
- all events for the IP
- access attempts
- bans/geoblocks
- insights
- manual CrowdSec actions when enabled
For local/private IPs, destructive actions such as bans are intentionally disabled.
Controlled actions
OpenSecDash routes external changes through its central Action Framework. The current built-in workflow supports CrowdSec ban and unban through LAPI.
Safety controls are applied before a plugin runs:
- action types and accepted target types come from the plugin registry
- critical actions require explicit confirmation
- private, loopback, reserved, and otherwise non-global IPs cannot be banned
- Viewer accounts cannot execute actions; Operator or Admin access is required
- dry-run simulation is enabled by default
- results are written to action history and normalized events
See Actions and safety for the execution model and troubleshooting guidance.
Persistent manual ASN bans
Persistent manual ASN bans are a characteristic OpenSecDash core workflow for repeated unwanted traffic from one autonomous system. In Events or Access, use Columns to show the optional ASN column, open an ASN popup, and confirm Permanently ban ASN. The column and popup also show the current ASN organization snapshot. Only an Operator or Admin can perform the action.
OpenSecDash stores the ASN as a permanent local policy. It does not create a permanent CrowdSec ASN decision and does not expand the ASN into prefixes. After a new public-IP event has been stored and successfully enriched by GeoIP, a matching policy creates an ordinary CrowdSec scope=Ip decision for 7d. An expired decision is not renewed by a timer; a later, newly enriched event is required before that IP can be banned again.
The workflow deliberately keeps ownership narrow:
- A reclassification to a different, non-blocked ASN immediately releases only the exact policy-owned decision. Independent CrowdSec decisions for the IP remain.
- A failed release stays queued against the exact decision ID for retry.
- Manually unbanning a policy-owned IP creates an exception for that ASN and IP only. Removing the exception is confirmed and requires another matching observation before a new ban can occur.
- The CrowdSec page shows policies, active policy-owned decisions, exceptions, removal errors, pending releases, and ASN-organization review warnings.
Every successful automatic policy ban creates one high-confidence IP Explorer insight with the ASN, organization snapshot, and 7d duration. It records that a ban happened; the CrowdSec panel remains the source for whether a decision is currently active. Ban counters and active-decision displays include these bans. Rollups, CrowdSec top scenarios, and the Dashboard group all ASN-specific scenarios under Manual permanent ASN ban, while Events and CrowdSec history retain the complete opensecdash/manual-permanent-asn-ban/AS... value for investigation and drill-down.
ASN allocation and its organization name can change. OpenSecDash keeps ASN organization separate from the IP-specific ISP/company value and shows both number and organization in the ASN column. A substantially different non-empty organization must be observed three times across at least two IPs before its previous snapshot and detection time become a review warning. Case, whitespace, punctuation around a legal suffix, and common legal-form variants alone do not count. An open warning is not repeated. Acknowledging the warning confirms only that it was reviewed. It neither proves an ownership transfer nor pauses the policy or removes decisions. Removing the policy is a separate confirmed action.
GeoIP and CrowdSec must be usable and Action simulation must be off to activate a real policy. Activation, removal, exception removal, and organization-review acknowledgement are confirmed, permission-checked, and audited. Existing policies stay visible if GeoIP later becomes unavailable, but no new automatic classification is enforced while it is down.
The first access cannot be blocked by this workflow The event is stored before asynchronous GeoIP enrichment creates a CrowdSec decision, and a bouncer must then fetch and apply it. Blocking can therefore happen no earlier than the second access, and that is not a guarantee: enrichment, LAPI, and bouncer latency or errors can allow additional accesses.
See CrowdSec for policy behavior and GeoIP for classification limits.
Responsive UI
OpenSecDash is designed to work on phones, tablets, and desktops:
- dashboard cards adapt to the screen
- dense tables become label/value cards on mobile
- long values open in touch-friendly overlays
- Events/Access columns can be customized
- actions are sized for touch input
- navigation stays easy to reach
Large data areas use progressive server rendering where it improves first paint: the page frame and controls appear first, followed by bounded result sections loaded through HTMX. Events and Access render their live-capable result tables immediately so their first live refresh does not flash an unnecessary skeleton.
Install from your browser
OpenSecDash includes a web app manifest, so modern browsers can add it as an app-like shortcut. This does not require an app store.
For the best install experience, serve OpenSecDash through HTTPS via your reverse proxy.
Sign-in and personal workspace
Internal authentication is on for a new installation, which sets its first Admin account up on the first visit; an updated installation keeps whatever it had, and OSD_AUTH_DISABLED=true runs OpenSecDash open on purpose. OpenSecDash provides Viewer, Operator, and Admin roles with revocable server-side sessions. Administrators can create users, reset passwords, change roles, and deactivate accounts. Sign-in can use local passwords, one optional OpenID Connect provider, or both; roles always stay local to OpenSecDash.
Each signed-in user can keep their own:
- language, theme, accent color, live-mode, and automatic-refresh preferences
- dashboard widget visibility and ordering
- Events and Access saved views
With internal sign-in disabled, these display preferences remain global and are configured under Settings → Core. See Authentication.
Instance identity and branding
An instance can show its domain, a short PWA description, a custom logo, and a custom favicon. OpenSecDash's own name and icon remain visible so screenshots and installed apps still identify the product clearly. Branding files are stored in the database and follow the normal /data backup.
See Instance branding.
Insights engine and correlation
The Insights engine is one of OpenSecDash's core features. It turns noisy homelab events into small, actionable hints that explain why something is interesting.
OpenSecDash creates insights from event patterns, for example:
- possible WordPress/phpMyAdmin/config-file probes from declarative insight rules
- access errors followed by security bans
- geoblocked requests
- manually triggered security bans
Heuristic web-probe rules can be updated from the OpenSecDash website without an app release, while still using declarative JSON data instead of remote code execution. See Insights engine.
The goal is not to be a SIEM. The goal is to surface useful context quickly and separate meaningful signals from background noise.
Asset Explorer
The Asset Explorer helps answer:
- Which apps are installed where?
- Which apps have known newer GitHub releases?
- Which systems have apps with updates?
- Which access events are related to a known asset host?
Assets represent services or apps you consciously run, such as Home Assistant, Nextcloud, Vaultwarden, Immich, Jellyfin, Traefik, Grafana, or Uptime Kuma.
Use the Show inactive and Show updates only checkboxes to narrow the system list. Each checkbox applies immediately while retaining the current asset search and source filter.
GitHub release checks
For assets with GitHub release URLs, OpenSecDash can check the latest release and mark apps with available updates.
The update checker uses a GitHub token when configured, which is recommended to avoid rate limits. During one update-check run, the same GitHub repository is only queried once even if multiple assets point to it.
Plugin diagnostics
The Diagnostics page shows:
- registered plugins
- whether each plugin is enabled
- datasource status
- runtime diagnostics
- recent manual actions
This makes it easier to understand whether a missing event is a configuration issue, a disabled plugin, or a runtime error.
Notifications
The Notifications page can turn matching events, insights, and newly available asset versions into SMTP email alerts. It keeps delivery history, supports a test email, and uses cooldowns and digest aggregation to avoid alert floods. See Notifications for setup and the built-in rules.
Trust-aware deployment
OpenSecDash understands X-Forwarded-For, X-Forwarded-Proto, and X-Forwarded-Host only from configured trusted proxy addresses. This preserves the real client IP and external HTTPS context without accepting spoofed forwarding headers from arbitrary peers.
The default trust set covers typical loopback and private homelab networks and can be narrowed—or disabled entirely—with OSD_TRUSTED_PROXIES. See the reverse proxy guide.